OASYS (Optimization of Airfoil SYStems)
Desktop design tool that optimizes airfoil geometry by sweeping aerodynamic parameters.
Summary
OASYS is a desktop lab tool that lets student engineers tweak camber, thickness, and chord parameters, instantly visualize the resulting airfoil, and fetch predicted lift/drag performance from XFoil. It distills the math-heavy optimization workflow into an interactive GUI so you can iterate on a wing section in seconds instead of wrestling with raw scripts.
Highlights
- Wrapped XFoil calculations in a Python analytics module to evaluate candidate airfoils as parameters update.
- Built a PyQt5 interface with live plotting, presets, and export options so teammates could iterate without touching code while still seeing the underlying equations.
- Automated unit conversions and guardrails that keep user inputs in physically valid ranges, preventing solver crashes.
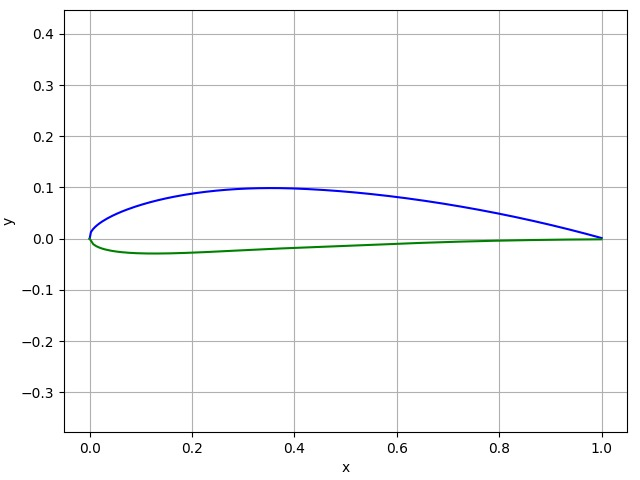
- Added comparison plots that overlay the user’s baseline profile against the optimized output, making it easy to see how the solver adjusted curvature and thickness distribution.
Outcome
Won Best Aviation Hack at hackTAMS 2020 by bringing aircraft design math to an accessible, student-friendly tool.
Inspiration
We were fascinated by how tiny tweaks to a wing cross-section completely change an aircraft’s efficiency. Rather than treat airfoil design as a black box, we wanted a playground where students could see how each slider affected the geometry and resulting coefficients.
What it does
The tool takes a user’s target geometry—max camber percentage, camber position, thickness, scaling—renders the airfoil in real time, and runs the profile through XFoil to compute performance stats. Users can flip between the baseline and optimized output, snapshot plots, and export coordinate tables for CAD or CFD pipelines.
How we built it
PyQt5 drives the GUI, Matplotlib renders the dynamic plots, and a set of Python helpers translate slider inputs into the parameter files that XFoil expects. When values change we regenerate the coordinates, call XFoil, and visualize the updated lift/drag predictions on the same screen so iteration feels instantaneous.
Challenges
The heaviest lift was wrangling the math—maintaining stable curves while performing unit conversions and ensuring we never feed XFoil a degenerate airfoil. Debugging a GUI that talks to a command-line solver also meant lots of process management to keep the UI responsive.
What we learned
We left with stronger instincts around numerical methods, PyQt5 architecture, and presenting complex engineering data in a way that invites experimentation instead of intimidation.
What’s next
Future work focuses on improving solver accuracy, importing airfoil libraries for comparison, and letting users export STL/STEP geometry so the profiles can go straight into CAD or wind-tunnel rigs.